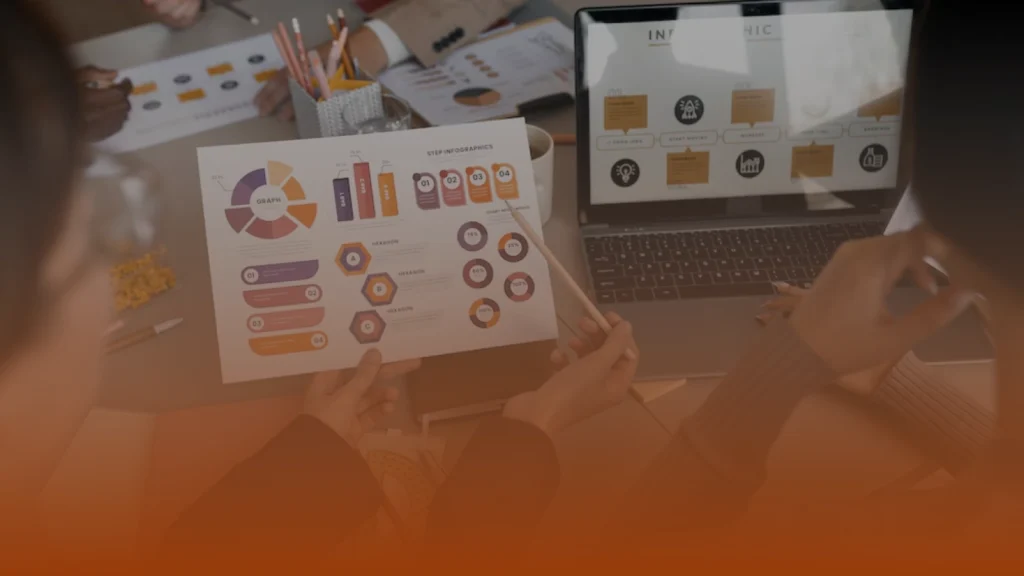
Visual content turns complex information into formats that audiences absorb faster, retain longer, and share more readily than text alone. For small and mid-sized businesses competing in crowded digital spaces, infographics are one of the most cost-efficient tools for improving both engagement and organic reach. This guide explains how they work, why they perform, and how Whissel Strategies builds them into a broader content strategy.
What Makes Infographics Work in Content Marketing
Content marketing has a saturation problem. Most buyers are exposed to more written content than they have time to consume, which means attention is the real scarce resource. Infographics in content marketing address this directly. They communicate at a glance, which reduces the effort required to extract value from a piece of content and significantly increases the probability that a reader will stay, absorb, and share.
At Whissel Strategies, infographics are not treated as standalone assets. They are built as part of a structured content strategy where every visual serves a defined audience need, sits within a well-optimized page, and is distributed through the channels most likely to reach the right buyers.
The Core Benefits of Infographics in Content Marketing
Improved Engagement
Visual content consistently outperforms text in time-on-page and interaction metrics. An infographic embedded in a blog post or service page gives readers a reason to stop scrolling and engage with the content more deeply. For businesses targeting buyers in research mode, higher engagement signals to search engines that the page is meeting intent, which supports rankings over time. The Nielsen Norman Group has documented that readers process visual information significantly faster than text, making infographics a direct lever for reducing bounce rates.
Enhanced Information Recall
The combination of text and visuals improves memory retention substantially compared to text alone. For service businesses whose buyers need to understand a process, compare options, or evaluate a methodology before committing, an infographic that communicates that clearly is more persuasive than a paragraph covering the same ground. Research published by Venngage shows that people retain roughly 65% of information when it is paired with a relevant visual, compared to around 10% for text alone.
Increased Shareability and Backlink Potential
Infographics are among the most shared content formats on social media and one of the most linked-to formats in editorial content. A well-designed infographic that presents original data or simplifies a complex concept in a new way earns organic backlinks from other websites, which builds domain authority and improves SEO performance over time. This makes them a dual-purpose asset: they serve your audience directly and strengthen the technical SEO foundation of your site.
How Whissel Strategies Builds Infographics Into Content Strategy
Audience Research First
Every infographic produced through Whissel Strategies begins with the same question: what does this audience need to understand, and what format will communicate it most clearly? The answer shapes every decision that follows, from the data sources used to the visual structure chosen. Infographics built without this foundation tend to be visually polished but strategically ineffective. The content production process at Whissel Strategies treats audience research as a non-negotiable first step for every asset type.
Compelling Visual Design
A strong infographic communicates its core message within seconds. That requires clear visual hierarchy, purposeful use of colour and typography, and data presented in the most intuitive format available. Charts, timelines, process flows, comparison matrices, and statistical summaries all serve different purposes. Choosing the wrong format for the content type reduces comprehension rather than improving it.
Strategic Channel Distribution
An infographic that no one sees produces no results. Whissel Strategies distributes infographic assets through the channels where target buyers are most active: embedded in SEO-optimized blog posts, shared through email newsletters, repurposed as social media content, and submitted to visual content platforms that generate additional backlinks. The distribution plan is built before production begins, not after.
Performance Tracking and Iteration
Every infographic is tracked against defined metrics: time on page, social shares, backlink acquisition, and conversion attribution where applicable. This data drives refinement across subsequent assets. Businesses that treat infographic production as a one-time effort rarely see compounding results; those that iterate based on performance data build increasingly effective visual content libraries over time.
What Infographic-Led Content Can Produce
Whissel Strategies has generated over $100M in client-driven revenue by combining content strategy with performance marketing systems. Visual content, including infographics, plays a significant role in that output because it accelerates the trust-building process that precedes a purchase decision. MS7 Construction is one example of a client whose targeted content strategy drove over $1.1M in revenue, supported by content assets that communicated value clearly and efficiently.
The agency accepts one new client per month to maintain the quality and strategic focus every engagement requires. Every content program is backed by the performance guarantee that if results are not profitable within 90 days, you pay nothing. That standard applies to infographic strategy the same as it applies to every other content deliverable.
According to HubSpot’s marketing research, content with relevant visuals gets significantly more views than content without them, and infographics specifically are among the top three most-used content formats by B2C marketers. For businesses in competitive local markets, this represents a meaningful differentiation opportunity that most SMBs have not yet fully tapped.
Where Infographics Fit in a Broader Content Strategy
Infographics are most effective when they are part of a structured content program rather than standalone assets. A well-placed infographic inside a pillar blog post increases time on page and improves the post’s search performance. An infographic that summarizes a case study communicates results more efficiently than a long-form write-up. A process infographic on a service page reduces buyer confusion and increases conversion rates.
Whissel Strategies integrates AI services into the content production workflow to improve speed and efficiency without compromising strategic quality. AI-assisted research and drafting free up time for the high-judgment work that produces differentiated visual content: audience analysis, message framing, and design direction.
When Infographics in Content Marketing Work at Their Best
The businesses that see the strongest results from infographics in content marketing are those where the visuals are integrated into a consistent publishing schedule, distributed through multiple owned channels, and tracked against real business metrics. A single well-designed infographic on a high-traffic service page can meaningfully improve conversion rates. A library of infographics covering a topic cluster can become the authoritative resource in a niche, earning backlinks and driving sustained organic traffic.
For established businesses ready to build that kind of content library, the starting point is a marketing solutions consultation to establish where visual content can close the largest gaps in the current strategy.
Frequently Asked Questions
1. What are infographics in content marketing?
Infographics are visual representations of information, data, or processes that combine text and graphics to communicate complex ideas more efficiently than text alone. In content marketing, they are used to improve engagement, simplify explanations, increase shareability, and build backlinks by providing content that other sites want to reference.
2. How do infographics help with SEO?
Infographics improve SEO in two primary ways. First, they increase time on page and reduce bounce rates, which are behavioural signals search engines use to assess content quality. Second, compelling infographics earn organic backlinks from other sites, which builds domain authority and improves rankings across the site. They should always be embedded within optimized pages with descriptive alt text and supporting body copy.
3. What types of infographics work best for small businesses?
Process infographics work well for service businesses that need to explain how their methodology differs from competitors. Statistical infographics perform strongly for businesses with proprietary data or research to share. Comparison infographics are effective at reducing buyer confusion when multiple options exist. The best type depends on what your buyers need to understand before they are ready to take action.
4. How often should a business publish infographics?
Quality matters more than frequency. One well-researched, strategically placed infographic that earns backlinks and improves page performance delivers more value than ten generic visuals published for volume. A reasonable starting point for most SMBs is one to two per month, placed in high-priority blog posts or service pages where they serve a clear audience need.
5. Can infographics work for B2B businesses?
Yes. B2B buyers research extensively before making decisions and frequently share resources within their teams. An infographic that simplifies a complex process, presents benchmark data, or compares strategic options is highly useful to B2B buyers and gets shared across organizations. For B2B businesses, infographics that demonstrate industry expertise are particularly effective at building authority and generating referral traffic.
6. How does Whissel Strategies measure infographic performance?
Performance is measured against the specific goals each infographic is designed to achieve: time on page and bounce rate for engagement, social shares and backlink acquisition for reach, and conversion attribution where the infographic is placed on a high-intent page. These metrics feed back into the content strategy to improve subsequent assets and build a visual content library that compounds in value over time.
Ready to Make Visual Content Work Harder for Your Business?
If your current content is not generating the engagement and organic visibility your business deserves, visual content strategy is one of the most direct levers available. Whissel Strategies works with one new client per month to build content programs backed by a 90-day performance guarantee.
Book a growth call directly with Whissel Strategies and find out where visual content fits in your specific growth plan.
Key Takeaways
- Infographics in content marketing improve engagement, information recall, and shareability simultaneously, making them among the highest-efficiency content formats available.
- SEO benefits are real: infographics earn organic backlinks, reduce bounce rates, and improve time on page, all of which contribute to sustained ranking improvements.
- Strategic distribution is as important as quality. An infographic embedded in an optimized blog post with supporting copy performs significantly better than a standalone visual asset.
- Performance tracking drives compounding improvement. Businesses that iterate on visual content based on real data build increasingly effective content libraries over time.
- Whissel Strategies backs every content program with a 90-day performance guarantee and accepts one new client per month to maintain strategic quality.